Debugging User Operations
When debugging user operations, Pimlico provides powerful tools to help you identify and resolve issues quickly. This guide covers the essential debugging techniques using request logs and the debugging section.
Using Request Logs
Request logs provide detailed insights into every API call made to Pimlico's infrastructure, helping you trace and troubleshoot user operations effectively.
Accessing Request Logs
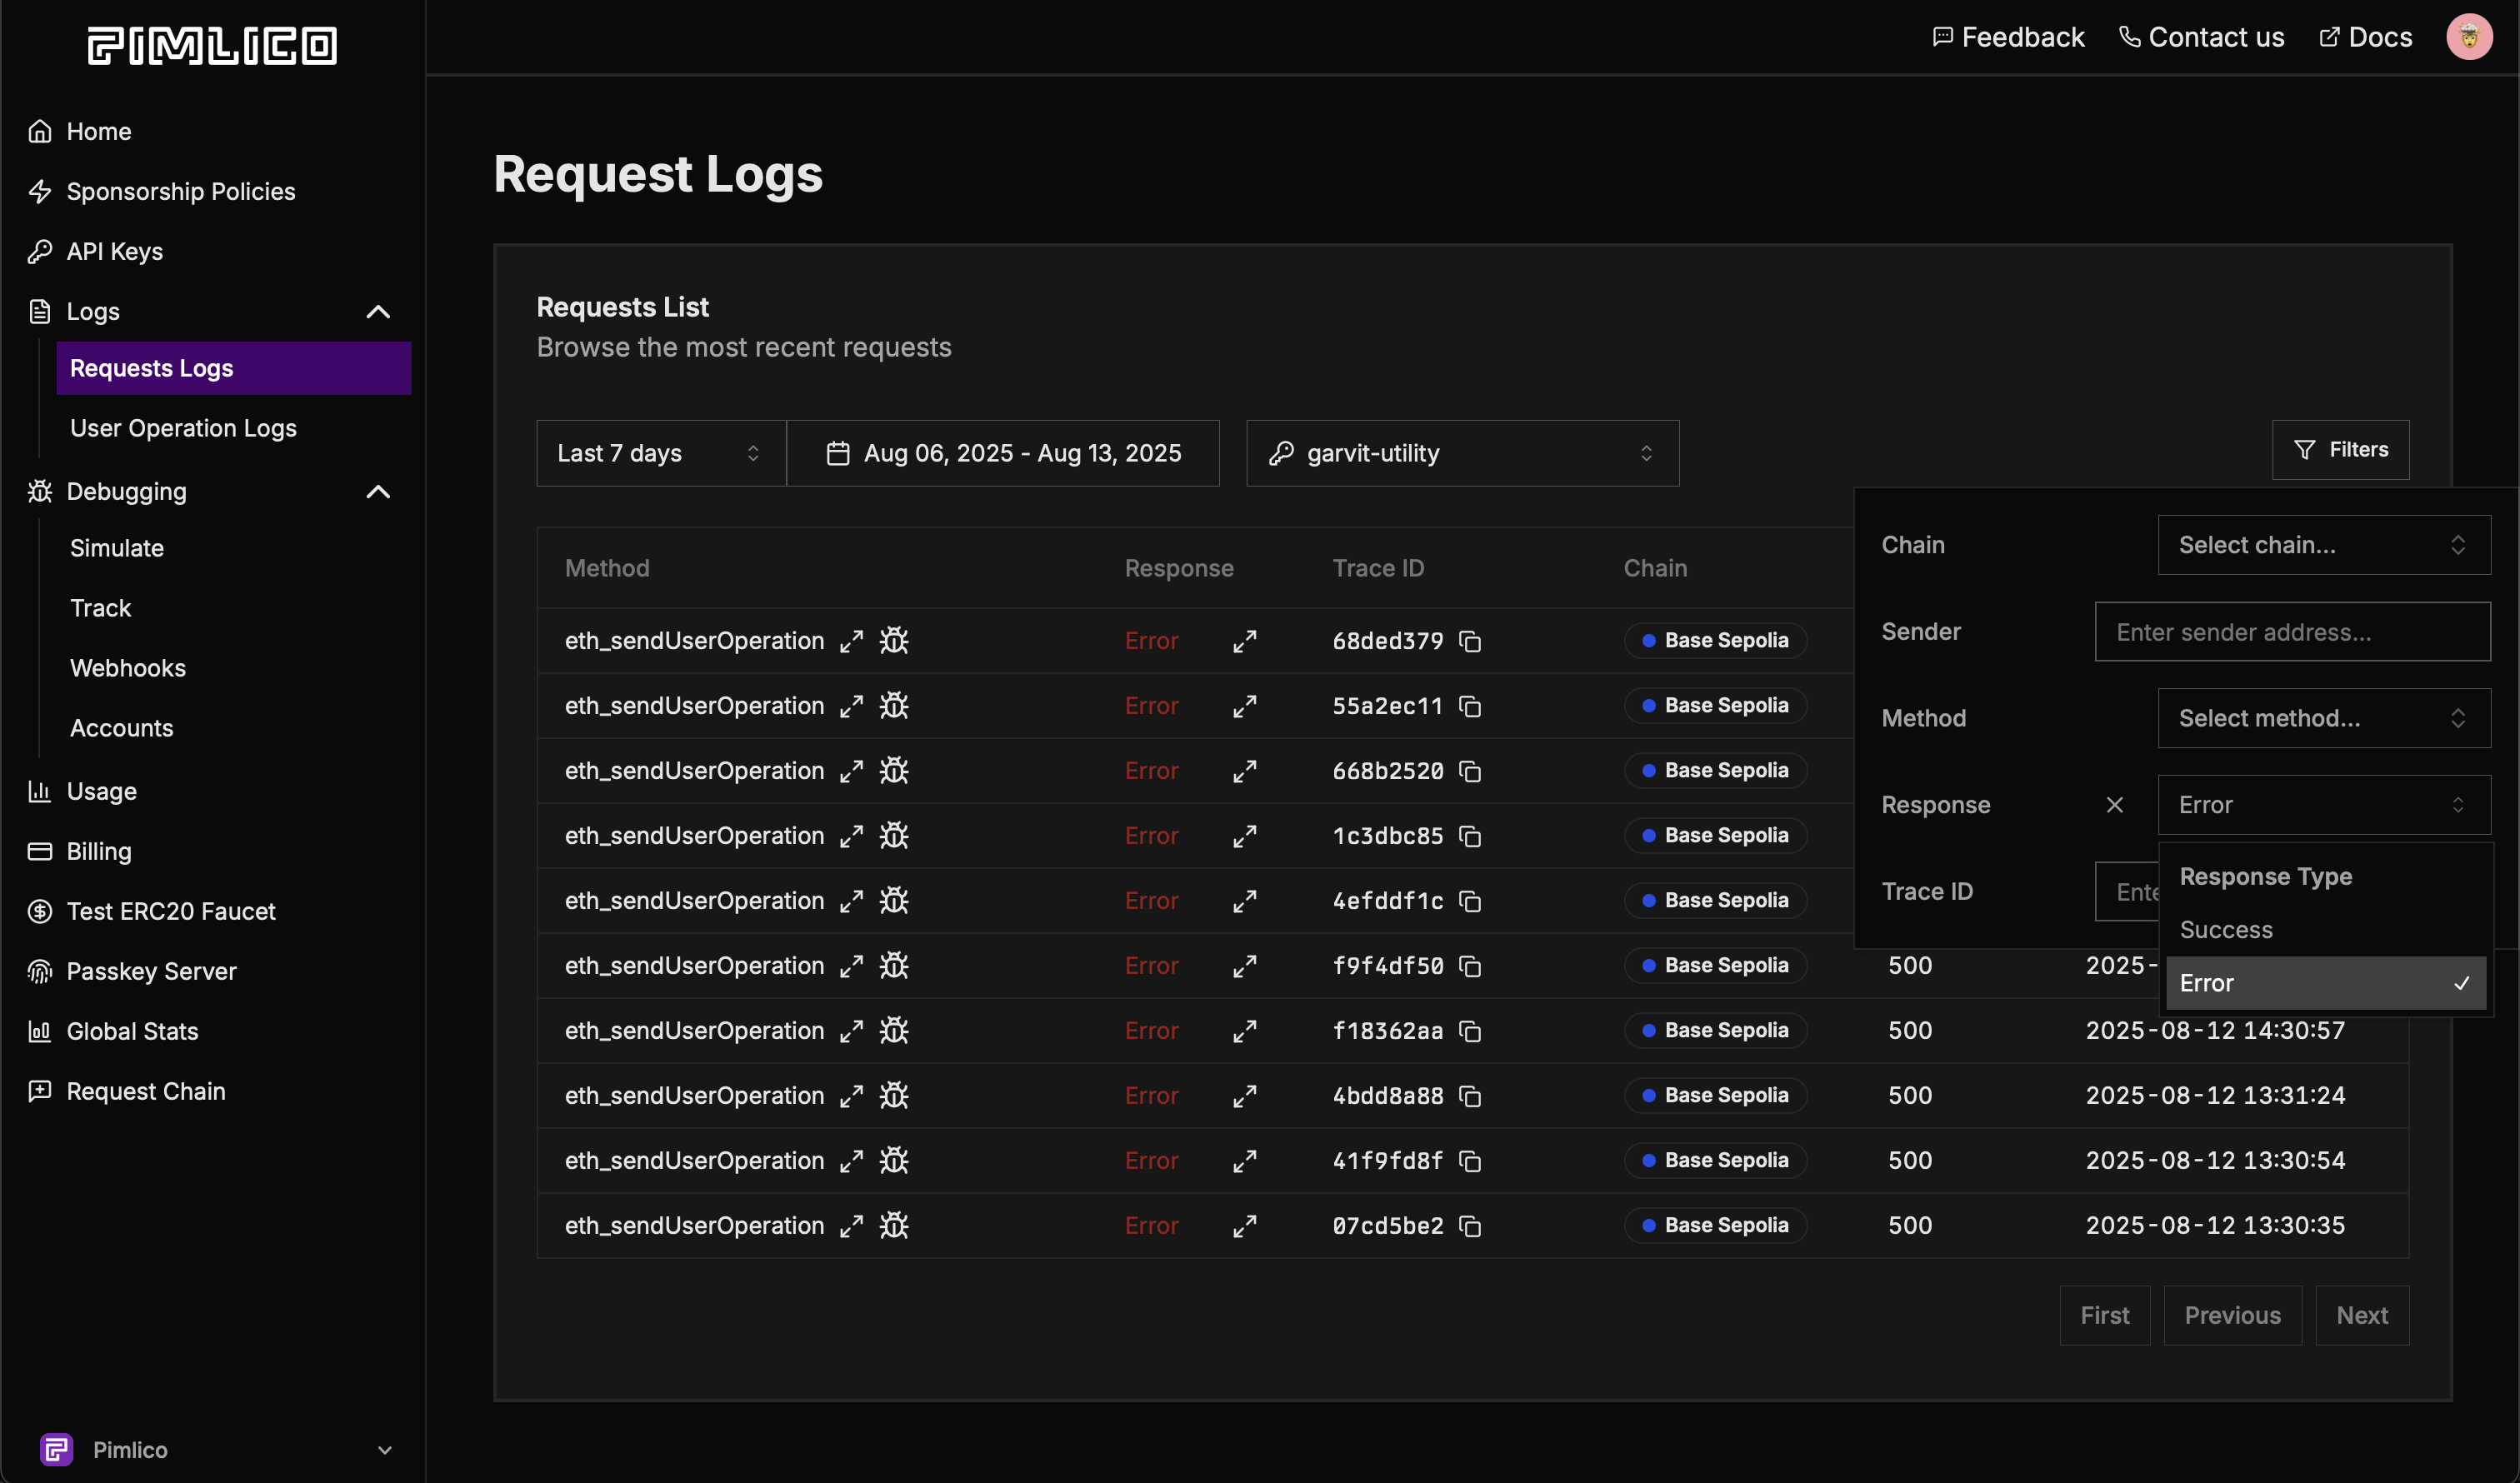
Navigate to the Request Logs section in the left sidebar of your Pimlico dashboard. This displays a comprehensive list of all recent requests made using your API keys.
Filtering Requests
The request logs interface provides powerful filtering options to help you quickly find the specific requests you're looking for:
-
Date Range: Narrow down requests to a specific time period using preset ranges like "Last 7 days" or define a custom date range.
-
API Key: If you have multiple API keys, select a specific one to view only its associated requests.
-
Chain: Filter by blockchain network to view only requests made on that chain (e.g., Base Sepolia, Ethereum Mainnet).
-
Sender: Enter a sender address to view all requests originating from a specific account. Particularly useful when debugging issues for a specific user.
-
Method: Filter by RPC method to see specific operation types (e.g.,
eth_sendUserOperation,eth_estimateUserOperationGas). -
Response Type: Choose between "Success" or "Error" to view only successful operations or failed ones.
-
Trace ID: Search by a specific trace ID from an error log or previous debugging session to jump directly to that request.
Common Debugging Scenarios
Failed User OperationsTo investigate failed user operations:
- Set Response Type to "Error"
- Filter by Method:
eth_sendUserOperation - Select the relevant time period
This shows all failed user operations with their error messages, helping identify patterns or specific issues.
Gas Estimation IssuesFor gas estimation problems:
- Filter by Method:
eth_estimateUserOperationGas - Look for error responses
- Check request payloads to ensure correct parameters
Debugging Individual Requests
Once you've located the request you want to investigate, click the debug icon (bug symbol) next to any request entry to access detailed debugging information.
![]()
The debugging page opens with all request details automatically populated, including user operation, entrypoint, chain, timestamp and type of request, e.g eth_sendUserOperation, eth_estimateUserOperationGas:
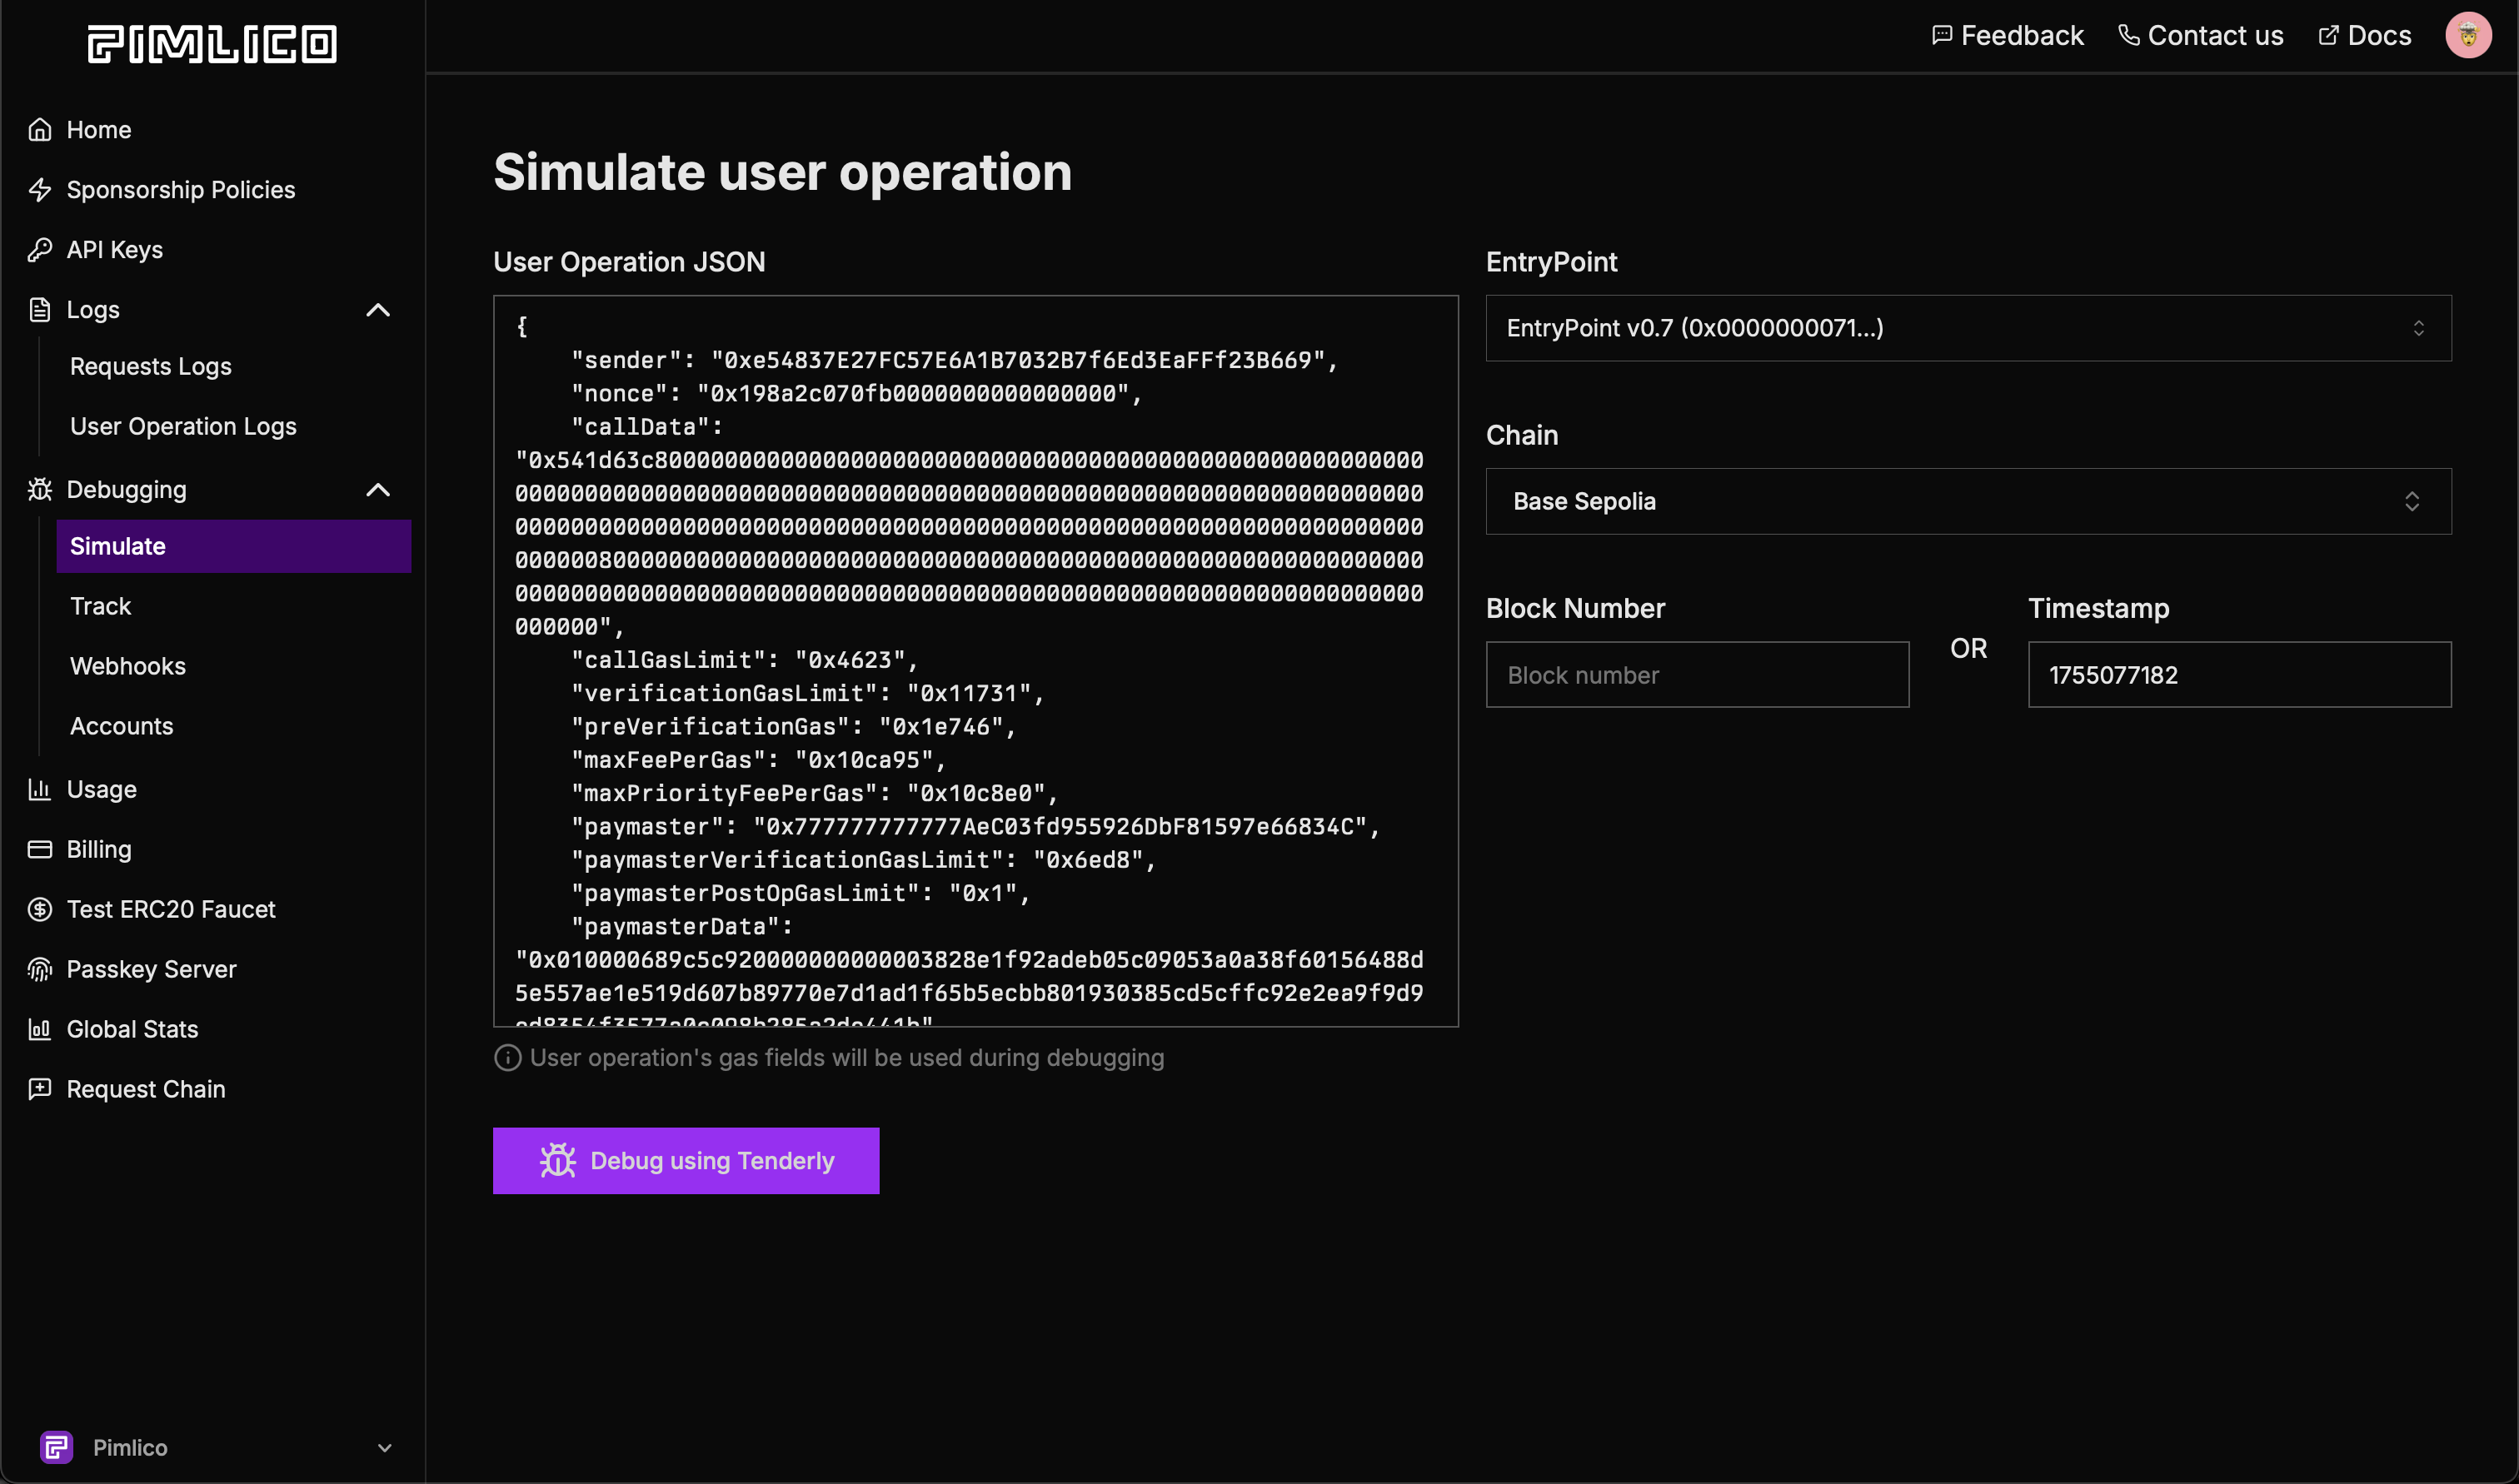
Click on the "Debug using Tenderly" will then redirect you to Tenderly's simulation link.
Using the Debugging Section
The debugging section can be accessed in two ways:
- From Request Logs: As shown above, clicking the debug icon next to any request automatically populates all details
- Direct Access: Navigate to Debugging → Simulate in the left sidebar to manually enter information for custom debugging
When accessing the debugging section directly, you can manually input operation details for custom debugging scenarios:
- User Operation: Paste the complete user operation object or hash
- Entry Point: Specify the entry point contract address (defaults to standard ERC-4337 entry points)
- Chain: Select the blockchain network where the operation was/will be executed
- Timestamp: Optionally provide a specific block timestamp for historical debugging
Once your operation details are loaded (either automatically or manually), you can click on the "Debug using Tenderly" which will then redirect you to Tenderly's simulation link.
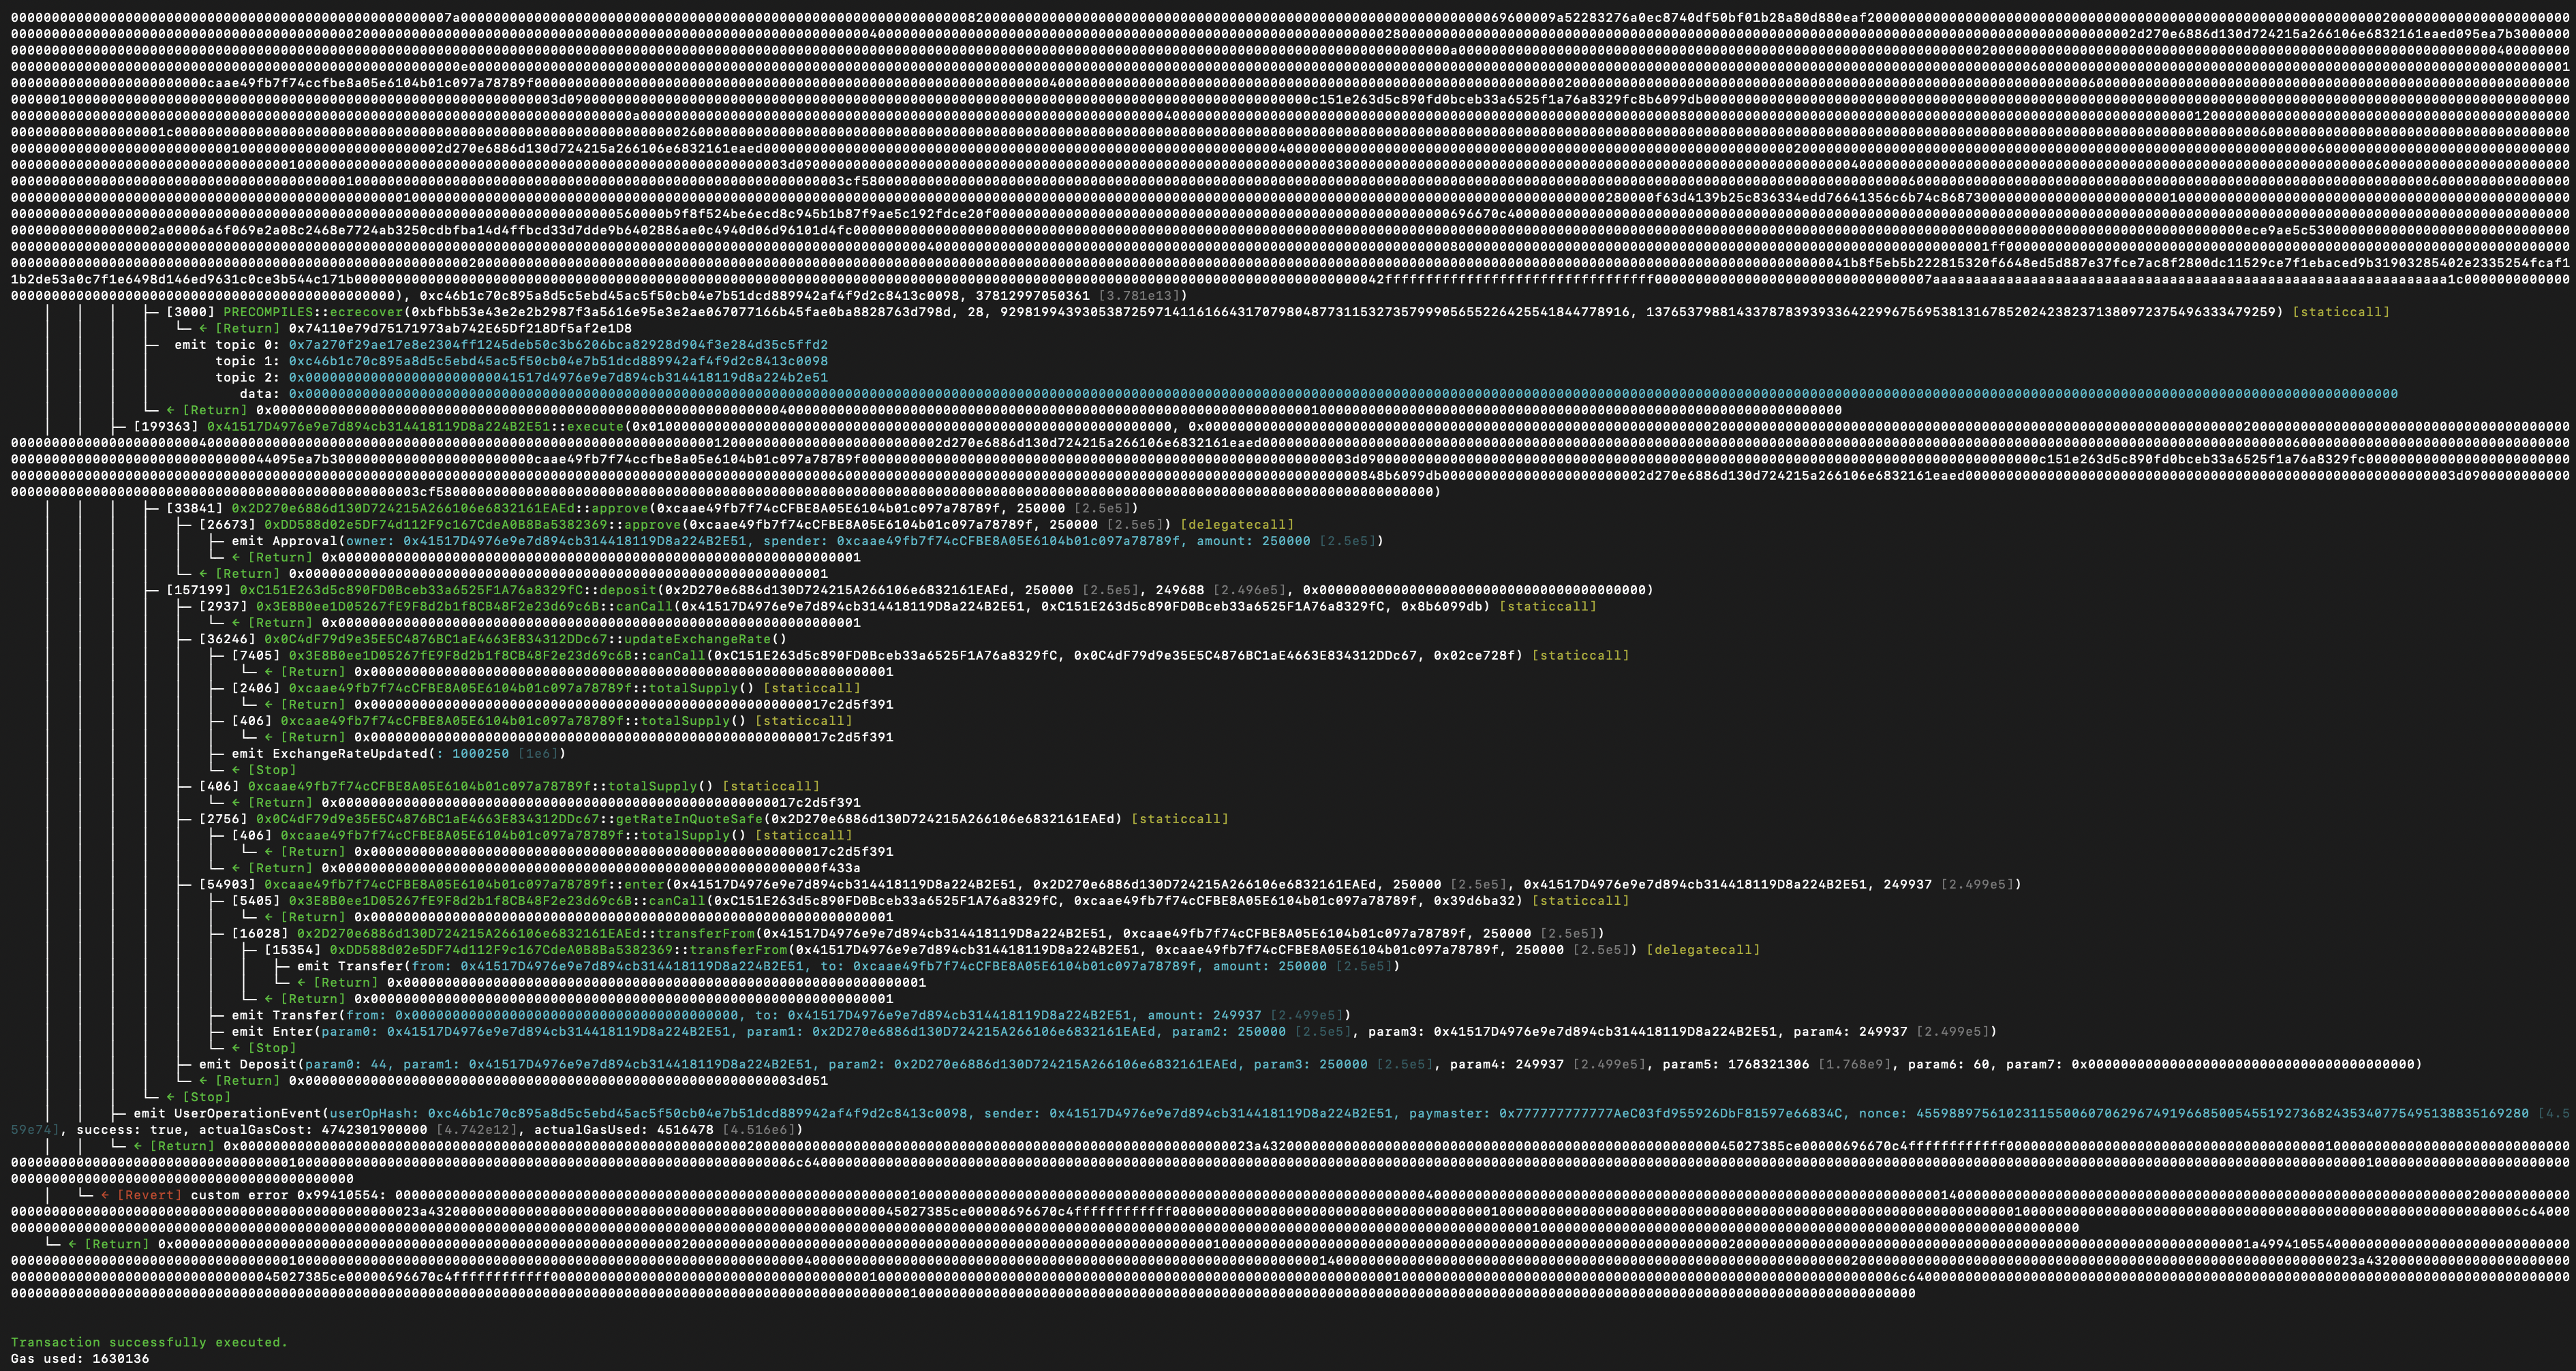
Debugging with Foundry's cast
Sometimes the Tenderly simulation is not enough to debug an issue. In these cases, you can use Foundry's cast tool to create a local trace.
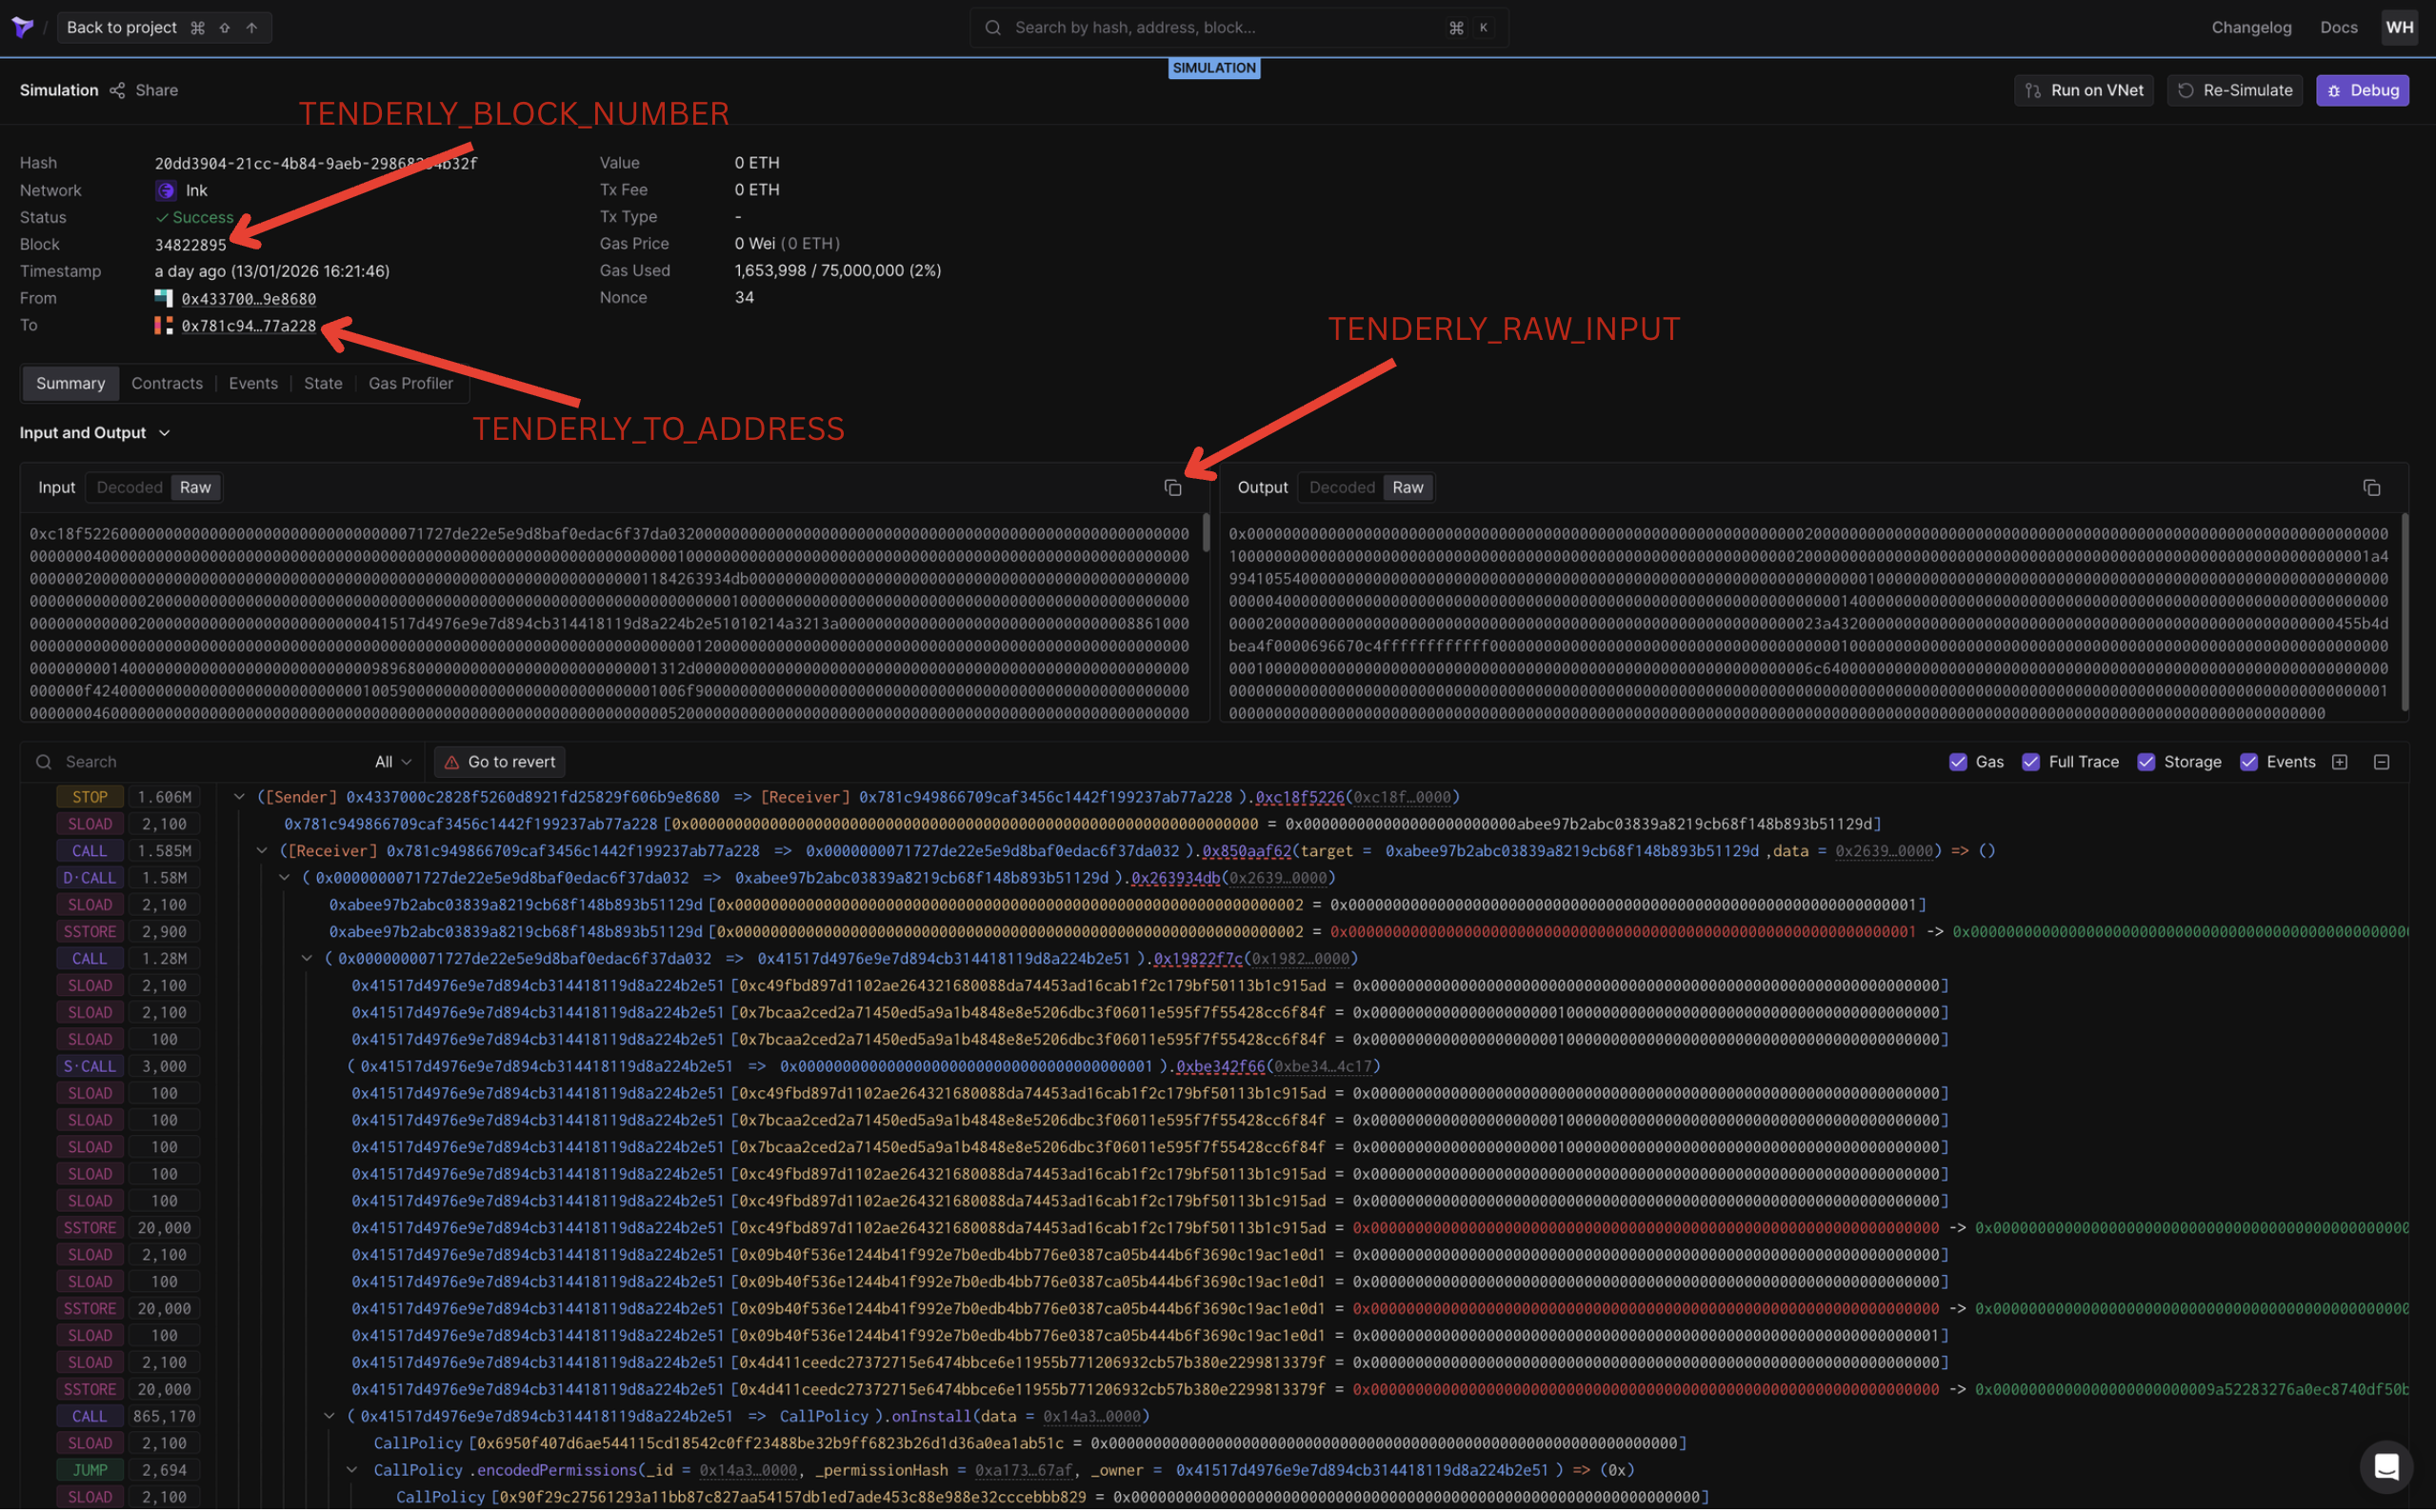
Using the values from the Tenderly simulation, run the following command in your terminal:
cast call $TENDERLY_TO_ADDRESS $TENDERLY_RAW_INPUT \
--block $TENDERLY_BLOCK_NUMBER \
--rpc-url $YOUR_RPC_URL \
--from $TENDERLY_FROM_ADDRESS \
--traceThe trace output looks like: